| 极致呈现系列之:Echarts饼图的千变万化 | 您所在的位置:网站首页 › echart 立体饼图 › 极致呈现系列之:Echarts饼图的千变万化 |
极致呈现系列之:Echarts饼图的千变万化
|
目录
创建一个最简单的饼图美化饼图修改颜色修改饼图的边框线条样式修改饼图的标签样式添加饼图的阴影效果添加修改饼图的图例样式
添加交互饼图的变化环形图动画装饰仪表盘
创建一个最简单的饼图
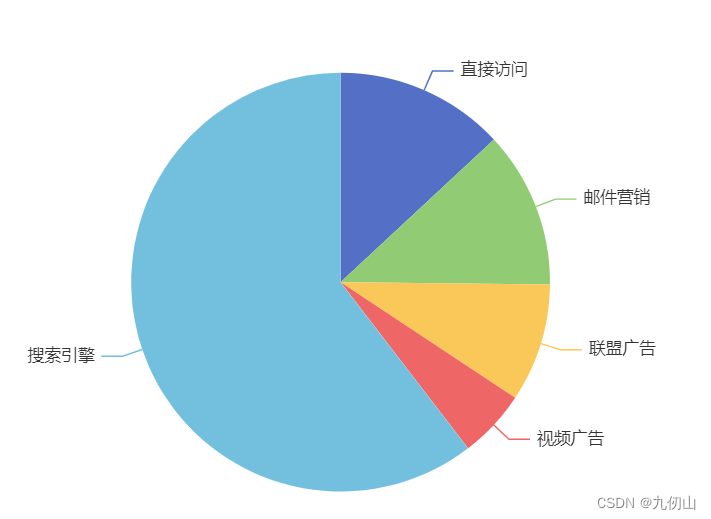
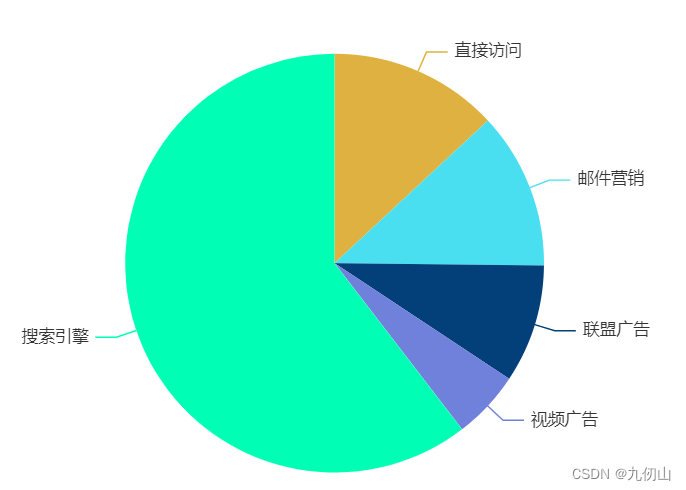
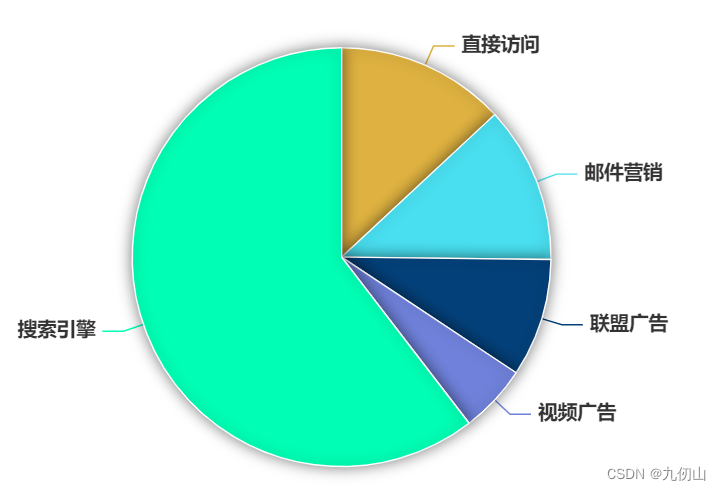
这个没什么好说的,懂的都懂,直接上代码 //安装 Echarts npm install echarts --save在 Vue 组件中引入 Echarts 并创建一个简单的饼图,代码如下: import * as echarts from 'echarts' import { ref, onMounted } from 'vue' const chart = ref(null) onMounted(() => { const myChart = echarts.init(chart.value) const option = { series: [ { type: 'pie', data: [ { value: 335, name: '直接访问' }, { value: 310, name: '邮件营销' }, { value: 234, name: '联盟广告' }, { value: 135, name: '视频广告' }, { value: 1548, name: '搜索引擎' } ] } ] } myChart.setOption(option) })运行代码,效果如下 通过设置color属性来修改饼图的颜色 const option = { color: ['#deb140', '#49dff0', '#034079', '#6f81da', '#00ffb4'], series: [ { type: 'pie', data: [ { value: 335, name: '直接访问' }, { value: 310, name: '邮件营销' }, { value: 234, name: '联盟广告' }, { value: 135, name: '视频广告' }, { value: 1548, name: '搜索引擎' } ], } ] }
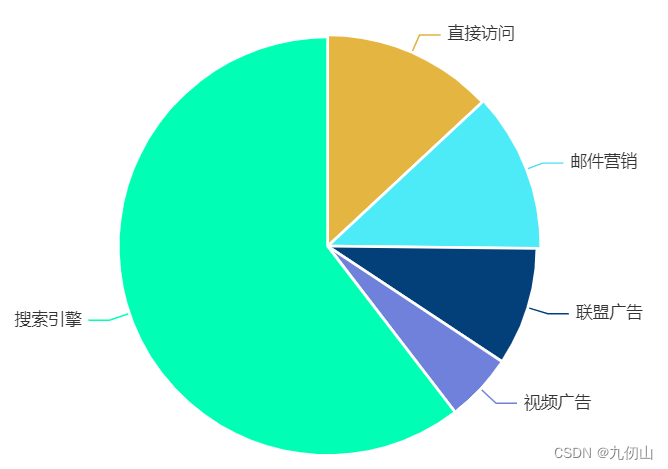
通过设置 itemStyle 属性中的 borderWidth 和 borderColor 来修改饼图的边框线条样式。 const option = { color: ['#deb140', '#49dff0', '#034079', '#6f81da', '#00ffb4'], series: [ { type: 'pie', data: [ { value: 335, name: '直接访问' }, { value: 310, name: '邮件营销' }, { value: 234, name: '联盟广告' }, { value: 135, name: '视频广告' }, { value: 1548, name: '搜索引擎' } ], itemStyle: { borderWidth: 2, borderColor: '#fff' } } ] }
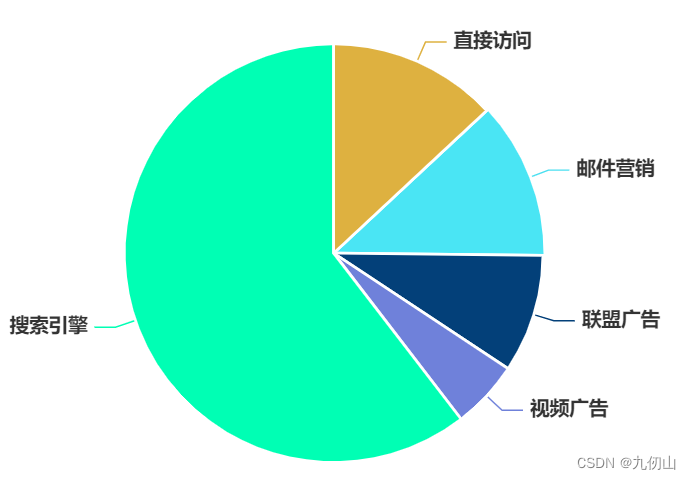
通过设置 label 属性中的 color、fontSize、fontWeight 等属性来修改饼图的标签样式。 series: [ { type: 'pie', data: [ { value: 335, name: '直接访问' }, { value: 310, name: '邮件营销' }, { value: 234, name: '联盟广告' }, { value: 135, name: '视频广告' }, { value: 1548, name: '搜索引擎' } ], itemStyle: { borderWidth: 2, borderColor: '#fff' }, label: { color: '#333', fontSize: 14, fontWeight: 'bold' }, } ]
通过设置 itemStyle 属性中的 shadowBlur、shadowColor 和 shadowOffsetX 等属性来添加饼图的阴影效果。 series: [ { type: 'pie', data: [ //数据 ], label: { // label配置项 }, itemStyle: { borderWidth: 1, borderColor: '#fff', shadowBlur: 10, shadowColor: 'rgba(0, 0, 0, 0.5)', shadowOffsetX: 0, shadowOffsetY: 0 } } ]
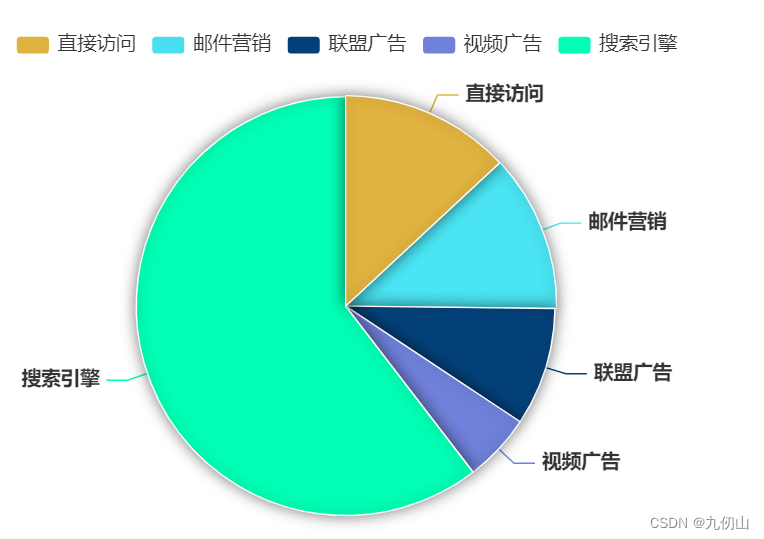
通过设置 legend 属性中的 textStyle 属性来修改饼图的图例样式。 color: ['#deb140', '#49dff0', '#034079', '#6f81da', '#00ffb4'], legend: { textStyle: { color: '#333', fontSize: 14 } }, series: [ //series代码块 ]
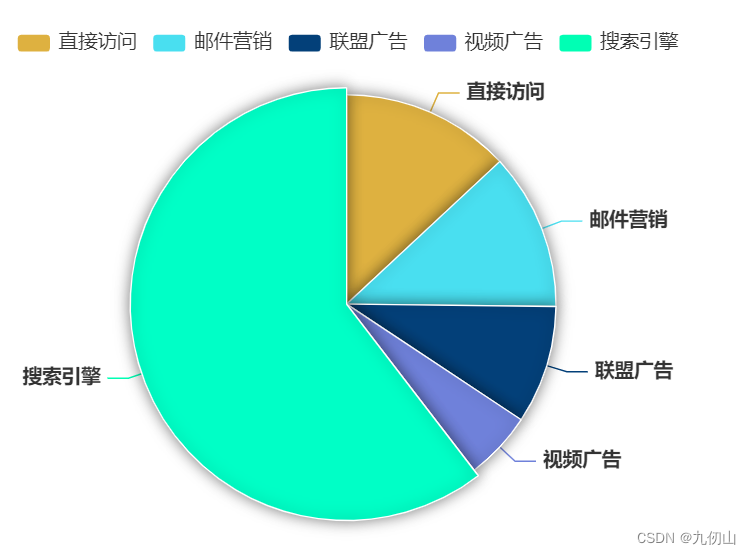
通过添加emphasis属性实现鼠标悬停高亮效果 series: [ { type: 'pie', data: [ { value: 335, name: '直接访问' }, { value: 310, name: '邮件营销' }, { value: 234, name: '联盟广告' }, { value: 135, name: '视频广告' }, { value: 1548, name: '搜索引擎' } ], emphasis: { itemStyle: { shadowBlur: 10, shadowOffsetX: 0, shadowColor: 'rgba(0, 0, 0, 0.5)' } }, label: { color: '#333', fontSize: 14, fontWeight: 'bold' }, itemStyle: { borderWidth: 1, borderColor: '#fff', shadowBlur: 10, shadowColor: 'rgba(0, 0, 0, 0.5)', shadowOffsetX: 0, shadowOffsetY: 0 } } ]
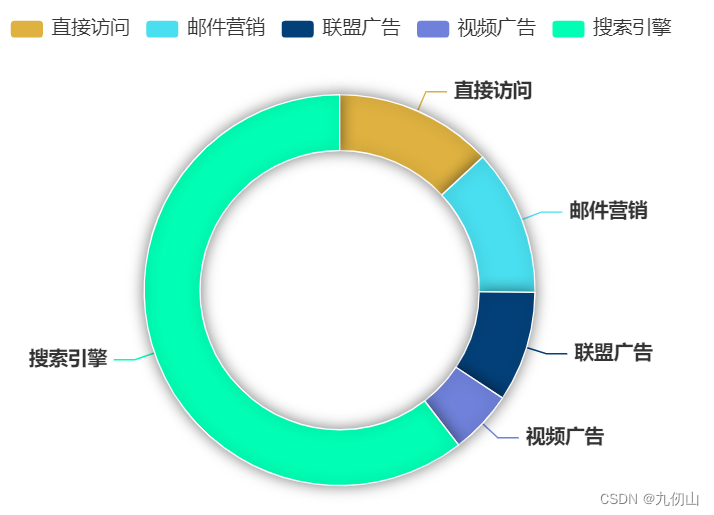
环形图是一种基于饼图的图表类型,它可以将饼图的中间部分空出来,形成环形的效果。要创建环形图非常简单,只需要在series中添加radius配置项就可以了,代码如下 series: [ { type: 'pie', radius: ['50%', '70%'], //...其他配置项代码 ]
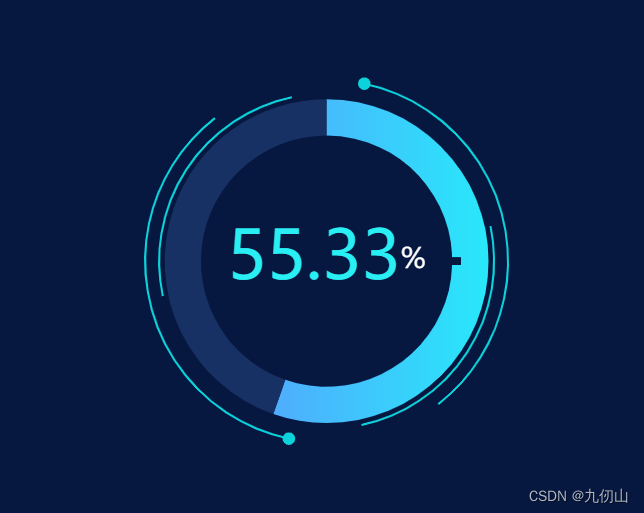
动画装饰仪表盘是一种基于饼图的图表类型,它可以将饼图的中间部分空出来,形成仪表盘的效果,并且可以通过动画效果让指针实时移动。以下是动画装饰仪表盘的代码: import * as echarts from 'echarts' import { ref, onMounted } from 'vue' const chart = ref(null) let angle = 0;//角度,用来做简单的动画效果的 let value = 55.33; let myChart = '' let option = {} onMounted(() => { myChart = echarts.init(chart.value) option = { backgroundColor: "#061740", title: { text: '{a|' + value + '}{c|%}', x: 'center', y: 'center', textStyle: { rich: { a: { fontSize: 48, color: '#29EEF3' }, c: { fontSize: 20, color: '#ffffff', // padding: [5,0] } } } }, series: [{ name: "ring5", type: 'custom', coordinateSystem: "none", renderItem: function (params, api) { return { type: 'arc', shape: { cx: api.getWidth() / 2, cy: api.getHeight() / 2, r: Math.min(api.getWidth(), api.getHeight()) / 2 * 0.6, startAngle: (0 + angle) * Math.PI / 180, endAngle: (90 + angle) * Math.PI / 180 }, style: { stroke: "#0CD3DB", fill: "transparent", lineWidth: 1.5 }, silent: true }; }, data: [0] }, { name: "ring5", type: 'custom', coordinateSystem: "none", renderItem: function (params, api) { return { type: 'arc', shape: { cx: api.getWidth() / 2, cy: api.getHeight() / 2, r: Math.min(api.getWidth(), api.getHeight()) / 2 * 0.6, startAngle: (180 + angle) * Math.PI / 180, endAngle: (270 + angle) * Math.PI / 180 }, style: { stroke: "#0CD3DB", fill: "transparent", lineWidth: 1.5 }, silent: true }; }, data: [0] }, { name: "ring5", type: 'custom', coordinateSystem: "none", renderItem: function (params, api) { return { type: 'arc', shape: { cx: api.getWidth() / 2, cy: api.getHeight() / 2, r: Math.min(api.getWidth(), api.getHeight()) / 2 * 0.65, startAngle: (270 + -angle) * Math.PI / 180, endAngle: (40 + -angle) * Math.PI / 180 }, style: { stroke: "#0CD3DB", fill: "transparent", lineWidth: 1.5 }, silent: true }; }, data: [0] }, { name: "ring5", type: 'custom', coordinateSystem: "none", renderItem: function (params, api) { return { type: 'arc', shape: { cx: api.getWidth() / 2, cy: api.getHeight() / 2, r: Math.min(api.getWidth(), api.getHeight()) / 2 * 0.65, startAngle: (90 + -angle) * Math.PI / 180, endAngle: (220 + -angle) * Math.PI / 180 }, style: { stroke: "#0CD3DB", fill: "transparent", lineWidth: 1.5 }, silent: true }; }, data: [0] }, { name: "ring5", type: 'custom', coordinateSystem: "none", renderItem: function (params, api) { let x0 = api.getWidth() / 2; let y0 = api.getHeight() / 2; let r = Math.min(api.getWidth(), api.getHeight()) / 2 * 0.65; let point = getCirlPoint(x0, y0, r, (90 + -angle)) return { type: 'circle', shape: { cx: point.x, cy: point.y, r: 4 }, style: { stroke: "#0CD3DB",//粉 fill: "#0CD3DB" }, silent: true }; }, data: [0] }, { name: "ring5", //绿点 type: 'custom', coordinateSystem: "none", renderItem: function (params, api) { let x0 = api.getWidth() / 2; let y0 = api.getHeight() / 2; let r = Math.min(api.getWidth(), api.getHeight()) / 2 * 0.65; let point = getCirlPoint(x0, y0, r, (270 + -angle)) return { type: 'circle', shape: { cx: point.x, cy: point.y, r: 4 }, style: { stroke: "#0CD3DB", //绿 fill: "#0CD3DB" }, silent: true }; }, data: [0] }, { name: '吃猪肉频率', type: 'pie', radius: ['58%', '45%'], silent: true, clockwise: true, startAngle: 90, z: 0, zlevel: 0, label: { position: "center", }, data: [{ value: value, name: "", itemStyle: { color: { // 完成的圆环的颜色 colorStops: [{ offset: 0, color: '#4FADFD' // 0% 处的颜色 }, { offset: 1, color: '#28E8FA' // 100% 处的颜色 }] }, } }, { value: 100 - value, name: "", label: { show: false }, itemStyle: { color: "#173164" } } ] }, { name: "", type: "gauge", radius: "58%", center: ['50%', '50%'], startAngle: 0, endAngle: 359.9, splitNumber: 8, axisTick: { show: false }, splitLine: { length: 60, lineStyle: { width: 5, color: "#061740" } }, axisLabel: { show: false }, pointer: { show: false }, axisLine: { lineStyle: { opacity: 0 } }, detail: { show: false }, data: [{ value: 0, name: "" }] }, ] } myChart.setOption(option) }) //获取圆上面某点的坐标(x0,y0表示坐标,r半径,angle角度) function getCirlPoint(x0, y0, r, angle) { let x1 = x0 + r * Math.cos(angle * Math.PI / 180) let y1 = y0 + r * Math.sin(angle * Math.PI / 180) return { x: x1, y: y1 } } function draw() { angle = angle + 3 myChart.setOption(option, true) //window.requestAnimationFrame(draw); } setInterval(function () { //用setInterval做动画感觉有问题 draw() }, 100);
好了,由于篇幅的原因,饼图的相关内容就介绍到这里,其实关于饼图的变化还有很多,比如断开环形图、进度环形图等,有兴趣的小伙伴可以深入研究下 |
【本文地址】
公司简介
联系我们